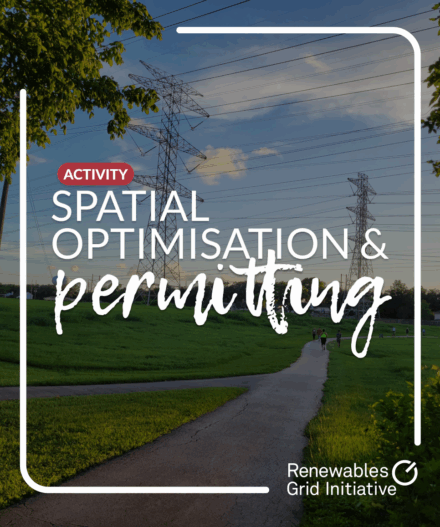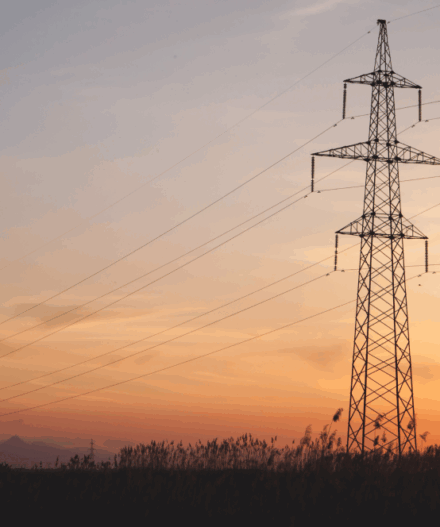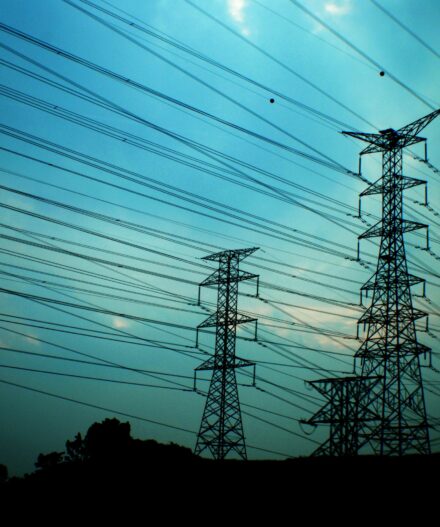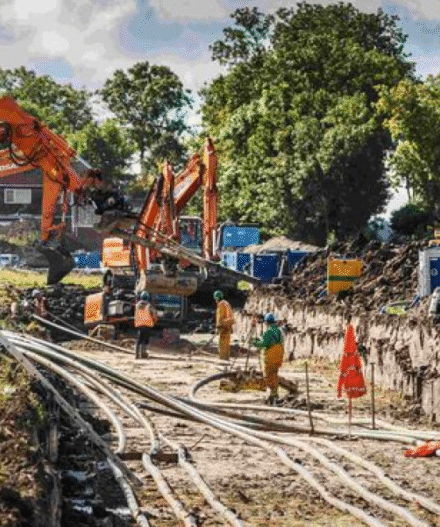


The European Union has pledged to decarbonise by 2050 in alignment with the Paris Agreement. Yet, as renewable energy deployment accelerates, the land and sea space needed for infrastructure deployment increasingly competes with biodiversity conservation, urban development, agriculture and other vital uses.
Background
Commissioned by the Renewables Grid Initiative and developed together with the Reiner Lemoine Institute, the below visualisation tool presents the results of a comparative analysis of spatial requirements, stemming from the implementation of different decarbonisation scenarios. The tool’s development was based on the Energy & Space Project and in collaboration with experts in energy system modelling.
Guide: How to use the interactive tool?
In order to use the tool in the most efficient way, please read this short tutorial which will guide you through the functionalities of the tool.
We recommend the use of this tool via desktop or laptop, as mobile screens might be too limited for the amount of data displayed. If you experience difficulties when trying to visualise the results or have question on the analysis, please contact us below.
First Step
Select the visualisation of your preference: either a single scenario or a comparative visualisation of two scenarios.
For results from a single scenario, click on “Single Scenario” and select one from the dropdown menu. For a comparison of different scenarios, click on “Scenario Comparison” and select the two scenarios you would like to compare.
A description of the selected scenario (or scenarios) alongside links for their data sets will show up below the boxes related to specific criteria.
Second Step
Specify the criteria you would like to be analysed according to the desired time frame, the spatial resolution, measurement unit and selected technologies.
To display results for a different year related to the scenario’s implementation, please choose a desired time frame (2030, 2040, or 2050) from the axis “Target Year”.
Likewise, select whether you would like to view either the spatial or water requirements for the implementation of the specific infrastructure as outlined by the different decarbonisation scenarios.
The results can be presented in various measurement units. In case of the area requirements, these could be either square kilometres (km²), a relative percentage for area requirements in relation to the entire available space, or soccer fields. Also, please note that space requirements for offshore wind are given in relation to the offshore area and presented by colouring the onshore area. Space requirements for nature-protected area are in relation to the entire on- and offshore area. When relative space requirements of several criteria are selected, they are added up. In case of the water volume requirements, the units are either million of cubic meters (Mio. m³) or Olympic swimming pools.
Lastly, different technologies can be displayed on the map by ticking/unticking the corresponding box in the “Criteria requirements” menu, presented on the right side of the tool.
Third Step
Visualise detailed information in the bar chart below the map.
You can click on a specific country or region in the map to generate a bar chart presenting the results of the chosen criteria. Alternatively, the region presented in the bar plot can also be chosen using the drop-down menu above the bar chart.
As a default, aggregated results for the European Union will be shown.
The selected criteria can be modified using the unit selection box on the right side of the bar chart without modifying the overall map results. Clicking twice on one criteria will lead the trace to be isolated within the bar chart.
Explore the tool
other energy & space resources


contact
Nathália Pimentel
nathalia[at]renewables-grid.euManager – Communication & Energy Systems

Dr. Andrzej Ceglarz
andrzej[at]renewables-grid.euDirector – Energy Systems

Nathália Pimentel
nathalia[at]renewables-grid.euManager – Communication & Energy Systems
Dr. Andrzej Ceglarz
andrzej[at]renewables-grid.euDirector – Energy Systems
related resources