

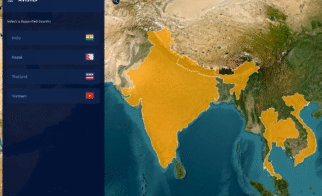
AVISTEP, developed by Birdlife International, was unveiled in 2022, emerging as a pivotal tool for global energy system planning, specifically gauging bird sensitivity to RES infrastructure like onshore and offshore wind farms, solar photovoltaic systems, and powerlines (high voltage transmission lines and lower voltage distribution lines). As the largest nature partnership in the world, Birdlife International uses the best available data and local experts to create robust sensitivity maps. Originally created for Vietnam, Nepal, India and Thailand, it has been implemented with some success in these regions and is currently being expanded to other countries. In 2024 it expanded to Egypth, Kenya, Laos and Uzbeksitan.

Highlights
01
A robust and replicable methodology for creating high-resolution bird sensitivity maps concerning wind (onshore and offshore), photovoltaic (PV), and overhead power lines (transmission and distribution).
02
Establish a global tool that infrastructure planners can use to find siting locations in lower-risk areas.
03
Create reliable sensitivity maps for the four project countries and quickly expand the analysis to more countries
04
Easy to operate with a tutorial, and demonstrates the sophisticated analysis and a large dataset.
Main Information
BirdLife International created AVISTEP to assist developers in site localisation for RES & grid infrastructure . This is even more urgent, considering the expected acceleration of the global energy transition. Poor planning may lead to habitat degradation and fragmentation, bird species endangerment – through direct mortality e.g. from collision and electrocution – and disruption of key nesting and migration sites. These losses would negate the carbon reduction impacts of the energy transition, as many of the key habitats and fauna act as carbon sinks. The creation of sensitivity mapping allows planners to see the broader scope of impact and incorporate it into their decision-making.
AVISTEP is the only tool to bring together global biodiversity datasets on Protected Areas, Important Bird Areas, the IUCN Red List and eBirds with nationally collated datasets on bird occurrence and high-resolution satellite imagery. As such, it brings global data and expert analysis to project countries packaged as an easy-to-read and accessible tool. The tool can be applied by the developers of any RES and grid project to find low-risk siting areas and prioritise retrofitting of mitigation measures.
The map was developed in a five-stage process (see more in this presentation by Tris Allinson):
1- Identify top priority species:
First, a formula was used to evaluate factors influencing mortality risk and inform a sensitivity index ranking species of highest concern. These factors are split into primary factors, namely species sensitivity to mortality (e.g. through collision and electrocution) based on morphological, ecological and behavioural traits; and conservation status. Aggravating factors include annual adult survival, and its percentage of the global population. The formula then produces a score to create a sensitivity index that ranks species of highest concern.
2 – Create a distribution map of priority species:
By matching species’ preferred habitat (acc. IUCN) with land cover data, the team created ‘Area of Habitat (AoH)’ maps showing available habitats to a species within its range. These maps were then converted into a 5km x 5km grid cell to give occurrence probability. Further refining of the map is based on observational records (e.g. e-birds, scientific literature and surveys), and the ‘probability to sensitivity value’ was linked using the Bradbury Formula.
3 – Create a cumulative species map:
All data on species distribution and their sensitivity to different infrastructure types were overlapped to create a cumulative species map.
4 – Add other layers for other sensitivity areas:
The team incorporated information on habitat and sites of conservation value from databases such as Copernicus Global Land Cover, World Database on Protected Areas (WDPA) and Important Birds and Biodiversity Areas (IBAS). This implies a positive correlation between increasing land value for biodiversity and the sensitivity score. Together, this created a sensitivity map that showed 5km x 5km grid cell values based on cumulative scoring.
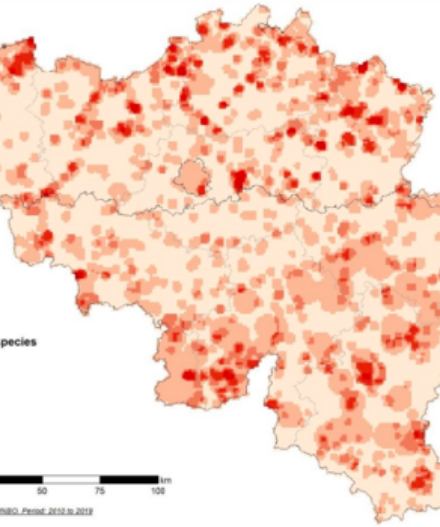
5 – Categorize sensitivity to produce final map:
By combining each layer and applying the cumulative species map, the final product of an interactive sensitivity map is produced showing the land type, bird population sensitivity, and development status overview. This map can then be used to see the suitability of a specific site for the development of wind, solar, and electricity grid infrastructure.
Implementation and looking forward
BirdLife intends to rapidly expand AVISTEP globally, focussing on countries with fast-emerging renewable energy sectors, high-value biodiversity, and low levels of existing regulations. Uzbekistan, Egypt, Kenya, and Laos will appear in the tool in July 2024 and Australia in 2025. Moving forward, it is intended that AVISTEP will become established as the global tool for assessing avian sensitivity in relation to energy infrastructure and therefore will underpin the next 10-20 years of the clean-energy transition.
Further Information
AVISTEP was funded by the e-Asia and Knowledge and Partnership Fund (EAKPF) and developed in partnership with the Asian Development Bank, DVG Interactive, Bombay Natural History Society (BNHS), Bird Conservation Nepal (BCN), Bird Conservation Society of Thailand (BCST) and Viet Nature. Additionally, the tool was developed with the support from the governments of India, Nepal, Thailand, and Vietnam.
other practices